


Basic Google Sheets formatting every PM should master.

You’re probably using sheets for all kinds of tasks from tracking project to-dos to performing data analysis. While many tools have come along to try to replace sheets, none have dethroned it. Sheets is both simple and versatile. However, I often read other PM’s spreadsheets and frequently feel like I’m deciphering hieroglyphics.
What is Google sheet formatting?
Formatting is the organization and styling of your Google sheet document (e.g., navigate among tabs, convey information via visuals such as font size or text and cell color).
Why care about Google sheet formatting?
Good formatting helps you:
Communicate your ideas clearly. It removes tangent information that is interesting, but doesn’t support your key message.
Collaborate with others. I can’t work to help you make something better if I don’t understand how I can or can’t help.
Aid you in recall. When you come back to your document a month later, you will know why you did XYZ.

Steps for formatting Google sheet.
Focus on the task at hand first, not the formatting. Think of formatting like editing. First, get your story on paper. Play around with the calculations. Once you get the basics, it’ll be easier to format without getting sidetracked and redoing a ton of work.
Create a “Doc Description” tab. This is the first tab and accomplishes two things:
Think of this as a README for the entire Google sheet. Answer the following questions: purpose, number of tabs, description of each tab.
Define standard visuals for labelling numbers and headlines. This helps with readability and understanding. The template I provide uses standards that are common for financial analysts in Excel so they should serve as a good foundation. Modify as you see fit.
Create a “Summary” tab. This document summarizes your key points by telling the reading what’s most important. Depending on the document, your summary tab may:
provide information on the key findings from your analysis
provide instructions on what you want the read to do in sheets
suggest other areas for further research, but you don’t touch
Rename the tab with your analysis/calculations/work as “Analysis”. You’ve probably been working on this sheet and related sheets. Identify the one that has the majority of your analysis. If you have other tabs, review them and label them appropriately (e.g., data, research, tangent analysis).
Hide or delete any tab that isn’t valuable anymore. People dread deleting anything, fearful that it’ll be useful “one-day.” If you’re one of those individuals, just hide the tab. Put yourself in the shoes of a spreadsheet reader who doesn’t know all the hard work you did. Do they need to review these tabs? If not, hide or delete it. Just make sure you go back to the “Doc Descriptions” and clearly list these tabs as hidden and give each a description. Your future self will thank you.
Google Sheet Template | Google Sheet Example
Principles for good sheets formatting
For ex-consultants or financial analysts, don’t over do formatting.

It isn’t because your skill isn’t valued. Many sheets you’ll create isn’t going to be nearly as detailed. Use that skill, but know that as a product manager, you need to balance where you spend your time. You’re no longer the financial analyst.
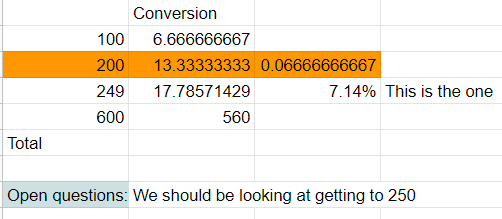
Create a column for comments or questions. Stay away from the Google Sheet commenting system. Unlike Google Docs where comments are easy to track and visible, Google Sheets follows Excel’s version of comments per cell. This means users have to hunt for comments by searching for icon on the ↗️ corner of each cell.

This significantly increases the likelihood of missing comments. Instead, add a comments column or row where collaborators can easily add comments. Provide instructions as needed. The one time to break this rule is if you’re collaborating with another advanced Excel/modeling person.

Additional Resources:
Great post - lots of value. Managed quick response of a major earthquake through google sheets - tips would have been very helpful than!