
Part 2: Important B2B SaaS metrics continued
Looking behind revenue metrics by drilling into user engagement metrics.

Previously, I wrote about B2B SaaS metrics that PMs should understand. I focused on answer two questions:
How much do you spend to acquire paid customers? -> Customer Acquisition Cost
How much do paid customers spend on your product/service? -> Average Revenue per Customer (ARPC)
In this article, I’m diving into the next two important questions.
How much does the product or service cost to make and sell? -> Cost of Service
How many of those paid customers will buy something next month, in month 3, and so forth. -> Retention

Cost of Service
When I wrote how to calculate Average Revenue per Customer (APRC), I stated it was important to calculate the average by grouping similar customers. This is because if you calculate APRC for all your customers, it isn’t a very useful metric. You just get a blended revenue number.
The grouping of similar customers foreshadows the need to understand costs on a grouped customer basis. You need to know how much it costs to service different customers and those costs aren’t the same. For example, some customers may use more of your product or require more customer support.
How to calculate the average Cost of Service.
Sum up the total expenditure during a time period that corresponds to ARPC measurement period. If you’re lucky, you can talk to someone in finance who has already built a good understanding of the different types of variable costs. If not, OpenView Partners suggest adding up the following when considering different contributions to your Cost of Service.
Application hosting and monitoring costs
Customer support and account management costs
Data communication expense
Software license fees for products embedded in the application
Website development and support costs
Professional services and training personnel costs
Costs of subscriptions
You also need to ensure you’re picking a time period when measuring spending that matches revenue. Since previously, I suggested monthly when calculating revenue, I’d use the same period.
Allocating cost on a per customer basis. If summing total cost is easy, allocating the cost is hard. There is no single right answer. Here are three methods and I recommend starting with simple.
Equal distribution. Take the total cost and divide it evenly per customer. It’s easy to calculate, but not the most accurate.
Usage / time based. Track specific usage by a customer. Only possible if you track and capture usage data.
Weighted distribution. Adjust the distribution. For example, Customer support and account management costs may be only applicable to enterprise customers who have dedicated Customer Success Managers (CSM).
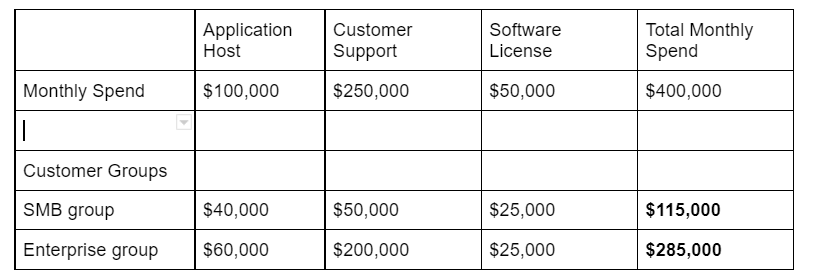
Sum total Cost of Service per customer group. If you have two ARPA customer groups, then you’ll need two different Cost of Service. Recall, the goal is to be able to easily calculate margins (ARPA - Cost of Service).

Retention and how it relates to engagement metrics.
Thus far, I’ve discussed metrics that are important, but also difficult for PMs to change directly. As PMs, you probably don’t have the sole power to increase prices or renegotiate vendor contracts to lower costs. But when it comes to retention metrics, we can decompose retention metrics by focusing on user engagement metrics that drive retention. This is where PMs can dive deeper.
The two types of retention metrics: revenue and users/customers.
When we talk about B2B SaaS retention metrics, there’s two ways to look at retention: by revenue and by user/customer. Recall that in B2B, the buyer isn’t always the user and growing users may not necessarily drive increases in revenue.
Thus, it’s common to break down retention:
Revenue retention via changes in recurring revenue (MRR, ARR)
User engagement via changes in active users (DAU, WAU, MAU)
Customer retention via changes monthly active customers (MAC)
Note: I’m using the term user as an individual and customer as business. So in some cases, you can have 1:1 where a single user = customer. In larger businesses, you might have 100:1 and in some cases, you can have several accounts for different business units within a business (100 users per 2 accounts for 1 customer).
We’ll work backwards, starting with customer retention.
Customer retention is the easiest to measure. Customers can either stay a customer or drop. To calculate customer retention:
Identify a group of customers with the same renewal periods and starting contract periods. In my previous example, I listed two customer groups (SMB and enterprise). I’d look within each of them to find a group of customers that:
Start their contract in the same month (e.g., May 2020)
Have the same renewal period (e.g., renewal monthly). You don’t want to include customers who have 1 year renewal periods with customers on monthly renewal because it will artificially inflate your retention numbers.
Determine the number of customers who stay 1 month after signing up for service. I’m using monthly retention assuming customers are signed up for monthly, but if your SaaS customers have annual contracts or another period, you’ll want to measure retention based on the first period when they can renew.
Repeat for each subsequent time period to identify when retention rate starts to level off. This is your “long-term” customer retention rate (r).
You now have all the pieces to calculate LTV by customer group:

Note: You’ll often see online writers say the simple LTV formula is.

Why is my formula different? Short answer, it’s not so let me explain.
ARPA = ARPC. I’m using the term Average Revenue per Customer instead of “Account” to be more customer centric in language. But they are interchangeable.
APRA*GM = APRC-COS. The GM is Gross Margin Rate, a percentage (%) number. When you multiply APRA and GM, you get the nominal Gross Margin, which is the same as APRC - COS. BTW: Gross Margin Rate is calculated ARPA - COS / ARPA.
Churn Rate = 1 - r (customer retention rate). 1 minus customer retention rate is the churn rate.
You can also calculate payback period in months by different channels and customer groups.

Next, we can move to user engagement
Users use and thus pay for your SaaS software if they get value. One way to measure value is via “active users” where you define a user as active if the user completes an activity or a series of activities using your software. This is not the same as measuring user logging in, which is one common, but incorrect metric used in place to measure “active users”.
How to measure user engagement
Define what “active” means. What are the buttons, tasks, or steps that would signal an user is “active”?
Set a normal measurement period for the activity. Normal here means what would you expect the typical user to do? For example, if the user was submitting expenses, is this done daily, weekly, monthly, or quarterly? Your period for measurement needs to match the normal user cycle first.
Measure by groups of users from customers that started at the same time. This requires some cohorting because measuring everyone together will result in a blended number.
Divide the number of “active” users by total users in your cohort. You’ll want to report this number as a percentage to understand the percent of users in your cohort who were active during the measurement period. Monitoring this number over time to measure if users are staying engaged, decreasing, or increasing.
Finally, we come to revenue retention.
When you read about SaaS metrics online, this is the one most frequently discussed. Whether reported annually (ARR), monthly (MRR), or as a percentage change month-over-month, everyone loves discussing recurring revenue. But recall, revenue is a lagging, descriptive indicator. It’s a measurement of what has already happened. Further, PMs can’t directly change recurring revenue. For existing customers, you can only influence recurring revenue by:
Driving engagement with existing product/feature, which reduces the likelihood of a customer stopping service (user/customer retention)
Introducing new product/features with new values (cross-sell)
Introducing same product/features to more users (expansion)
Introducing improved version of the product/feature to same users (up-sell)
This is why I focused on this metric last. It’s important within retention, but I don’t think is as helpful in suggesting actions a PM should take. To calculate MRR, all you have to do is sum up the recurring revenues collected from a group of similar customers.
Closing thoughts
Writing this post concisely was a struggle. I struggled with business vs. product metrics. It was only at the end, I could see that PMs need to understand business metrics (CAC, APRC, COS, and Retention Rate), but needed to dive deeper into user engagement metrics, which I briefly discussed. There’s a lot more to discuss, such as “how do you measure engagement if your product that have multiple value-add features” or “how do you measure engagement if the user is using multiple products?”.
In addition, I struggled with how to write about revenue. From reading various articles online, this complexity is caused by the changing ways in which SaaS products have been sold, moving from multi-year selling to CIOs, to annual contracts with business unit leaders, to monthly subscription to end-users. Secondly, most metrics discussed are more sales/business oriented. So, I summarized that confusion to a chart. This is the reason I don’t discuss metrics like TCV or ACV because those are more salesforce oriented metrics (i.e., bookings) vs. actual revenue or forecast based on historical actuals.

Lastly, all these discussions around cohorting made me realize that for early stage startups, you run into many issues with cohorting, the biggest being small sample size. In many cases, I am assuming we can draw inference from a group of customers, such as the average revenue or retention rate. But when sample sizes are very small, variations may be more due to noise so we’re drawing the wrong conclusion. That’s why there’s a phrase "Lies, damned lies, and statistics".
Enjoy reading? Subscribe or better yet, join others who have pre-ordered my book. Hate what I wrote or disagree, leave a comment below.
Sources: